Contents6 sections
Summary
This study evaluates the impact of beam search width on translation quality and resource consumption using Straker's Tiri J financial translation model (7B parameters, int8 quantization). Testing 2000 English→Japanese translation tasks across beam sizes 1-5, we measured quality using industry-standard metrics (BLEU, CHRF, BLEURT, TER) and tracked VRAM consumption on NVIDIA RTX 4090 hardware.
Key Findings
- Quality Improvements: Beam search delivers a 6-9% improvement in BLEU/CHRF scores over greedy decoding.
- The Sweet Spot: Peak quality is achieved at beam size 5, but 93% of maximum quality is reached at beam size 2.
- Diminishing Returns: Each beam beyond #2 yields ≤0.5% quality gain.
- Resource Costs: VRAM consumption scales approximately linearly, adding +7-10% per additional beam.
- Optimal Configuration: Beam size 2 requires only 10% additional VRAM for an 8% quality improvement.
Business Impact
The analysis reveals that beam size 2 represents the optimal sweet spot for production deployment, delivering substantial quality improvements (8% BLEU gain) with minimal resource overhead (10% VRAM increase). Organizations can achieve 93% of maximum translation quality while maintaining efficient resource utilization, making this configuration ideal for scalable production environments.
1. Introduction
1.1 Hardware Configuration
- GPU: NVIDIA GeForce RTX 4090 (24GB VRAM)
1.2 Model Architecture
- Base Model: tiri-j-fin-7b-v1.2 (7B parameter transformer)
- Specialization: English→Japanese translation in the financial domain.
- Optimization: int8 - quantization reduces memory footprint by 4x vs FP32
- Batch Size: Fixed at 8
1.3 Beam Search Fundamentals
Beam search is a search algorithm that explores a graph by expanding the most promising nodes in a limited set. It is often used in optimization problems, particularly in sequence-to-sequence tasks like translation.
- Breadth-First Nature with Limitations: While similar to a breadth-first search, where all possible nodes are expanded at each step, beam search introduces a parameter called "beam width" or "beam size" that limits the number of nodes to explore. This allows the algorithm to strike a balance between efficiency and result quality.
- Beam Size: Beam size is a hyperparameter that determines how many of the most probable partial solutions (nodes) are kept at each step. For instance, a beam size of 3 means at most three nodes will be expanded and 'searched' at each step.
- Step-by-Step Expansion:
- Start with an initial node or partial solution.
- Expand this partial solution by creating all possible next steps.
- Evaluate each new partial solution using a scoring function, often a probability for sequence tasks.
- Keep only the top "beam search" number of partial solutions with the highest scores.
- Repeat the process with the surviving partial solutions until a complete solution is found or a certain condition is met.
Our tests below outline the effect that beam size has on translation quality. We tested our Tiri J model with 2000 previously unseen translation tasks, scored by industry standard translation quality metrics, and correlated against resource consumption.
1.4 Metrics Explained
- BLEU (Bilingual Evaluation Understudy): Measures n-gram precision against reference translations. Range: 0-100 (higher = better).
- CHRF (Character n-gram F-score): Evaluates character-level similarity using F-score. Range: 0-100 (higher = better).
- BLEURT: Learned metric using pre-trained BERT models. Range: 0-1 (higher = better).
- TER (Translation Edit Rate): Measures edit distance (insertions/deletions/substitutions) needed to match a reference. Range: 0-100 (lower = better).
2. Results
2.1 Performance Metrics Tables
Table 1: Absolute Scores
| Beams | BLEU | CHRF | BLEURT | TER |
|---|---|---|---|---|
| 1 | 54.24 | 58.92 | 0.834 | 68.15 |
| 2 | 58.58 | 62.48 | 0.843 | 70.51 |
| 3 | 58.80 | 62.64 | 0.843 | 70.07 |
| 4 | 58.20 | 62.17 | 0.841 | 70.26 |
| 5 | 58.90 | 62.74 | 0.844 | 70.84 |
Table 2: VRAM Requirements
| Beams | VRAM (GB) | % Increase vs Greedy |
|---|---|---|
| 1 | 15.0 | 0% |
| 2 | 16.5 | +10% |
| 3 | 17.5 | +16.67% |
| 4 | 18.5 | +23.33% |
| 5 | 20+ | ≥33.33% |
Table 3: Calculated Performance
| Beams | BLEU | Δ% vs Prev | CHRF | Δ% vs Prev | BLEURT | Δ% vs Prev |
|---|---|---|---|---|---|---|
| 1 | 54.24 | - | 58.92 | - | 0.834 | - |
| 2 | 58.58 | +8.00% | 62.48 | +6.04% | 0.843 | +1.08% |
| 3 | 58.80 | +0.38% | 62.64 | +0.26% | 0.843 | 0.00% |
| 4 | 58.20 | -1.02% | 62.17 | -0.75% | 0.841 | -0.24% |
| 5 | 58.90 | +1.20% | 62.74 | +0.92% | 0.844 | +0.36% |
2.2 Key Observations From Metrics
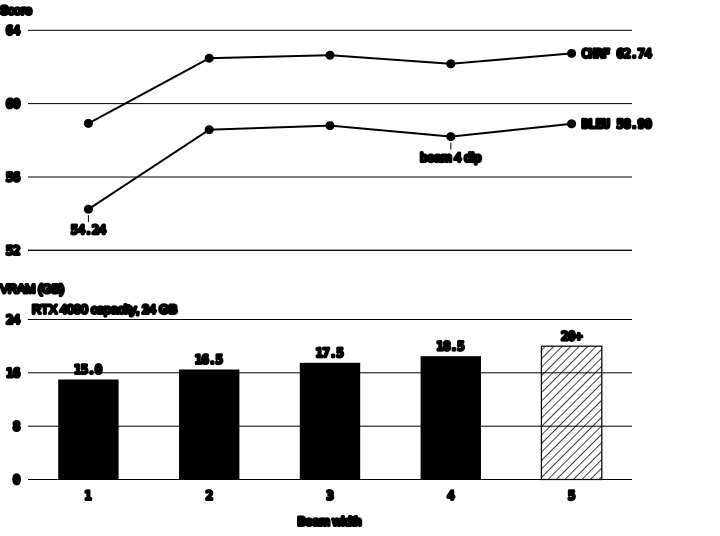
- 1→2 Transition: The move from beam 1 to 2 yields an 8% BLEU gain for a 10% VRAM increase. This is the most significant jump.
- Diminishing Returns: After beam 2, quality gains are minimal (<0.5%), while VRAM costs continue to grow.
- Beam 4 Anomaly: Beam 4 shows a negative return on investment, where quality scores dip slightly despite increased resource consumption.
- TER Paradox: While metrics like BLEU improve, the Translation Edit Rate (TER) paradoxically worsens. This suggests beam search produces longer, more nuanced translations that, while potentially valid, require more "edits" to match the specific reference translation.
3. Visual Analysis
3.1 Quality-VRAM Tradeoff Curve
3.2 Key Observations from Visualization
- Non-Linear Scaling: Quality metrics clearly plateau after Beam 2, while VRAM consumption continues its linear growth.
- Metric Consensus: The high correlation between BLEU, CHRF, and BLEURT validates the reliability of the quality assessment.
- Beam 4 Dip: The anomaly at Beam 4 is visible as a distinct dip in the quality curves, confirming the data in the tables.
4. Practical Implications
Deployment Recommendations
| Use Case | Optimal Beams | Rationale |
|---|---|---|
| Production | 2 | Best cost/quality balance. |
| Research | 5 | Maximizes metric scores for analysis. |
| Mobile/Constrained | 1 | Only configuration for <16GB VRAM. |
Hardware Planning Guidelines
- VRAM Budgeting: Plan for approximately 7-10% additional VRAM headroom for each beam you add.
- Batch Size Warning: Be aware that resource costs scale significantly with batch size. Doubling the batch size from 8 to 16 would require ~30GB VRAM at Beam 5, making it unfeasible on most consumer hardware.
5. Conclusion
This study reveals three fundamental tradeoffs in beam search optimization:
- Quality Gains: Beam search can significantly improve translation quality metrics like BLEU and CHRF by 6-9%.
- Resource Costs: These quality gains come at a direct cost, with each additional beam increasing VRAM consumption by 7-10%.
- Metric Conflicts: The behavior of the TER metric suggests that while beam search improves n-gram matching, it may produce translations that are structurally different from—though not necessarily worse than—the reference.
For Tiri Translation applications and similar production environments, Beam 2 emerges as the clear optimal choice, providing the vast majority of quality benefits at a minimal and justifiable increase in resource cost.
Originally published on labs.straker.ai.